

Numbers can be a funny thing. On the one hand, they provide great metrics in situations when anxiety or emotions could affect one’s judgement. On the other hand, they can just as easily be used to paint a desired narrative, one that is often diluted of truth.
The latter is what happened on Tuesday, when one of Canada’s leading real estate companies decided to do a media blitz striking FOMO (the “fear of missing out”) back into the hearts of over-leveraged Vancouver-area residents with respect to their local real estate market.
Whether you heard it on News1130, read about it in the Vancouver Sun, or watched it on Global, the message was the same: Vancouver’s housing correction is over and the market is about to explode once again. But hang on a second… are all of the fancy statistics really the basis of this hypothesis, or does the fact that agents simply aren’t making as much money in 2017, because sales are down by nearly 50% from last year, have something to do with it?
Let’s take a look at some of the facts being thrown around. The first set of stats highlighted for the media was how the price of a house in Greater Toronto went up 20% in the first quarter of 2017, and in Vancouver, 12.3% over the past year. Why would they state one market quarterly and one market per annum? Let’s have a look at Greater Vancouver over the past year:
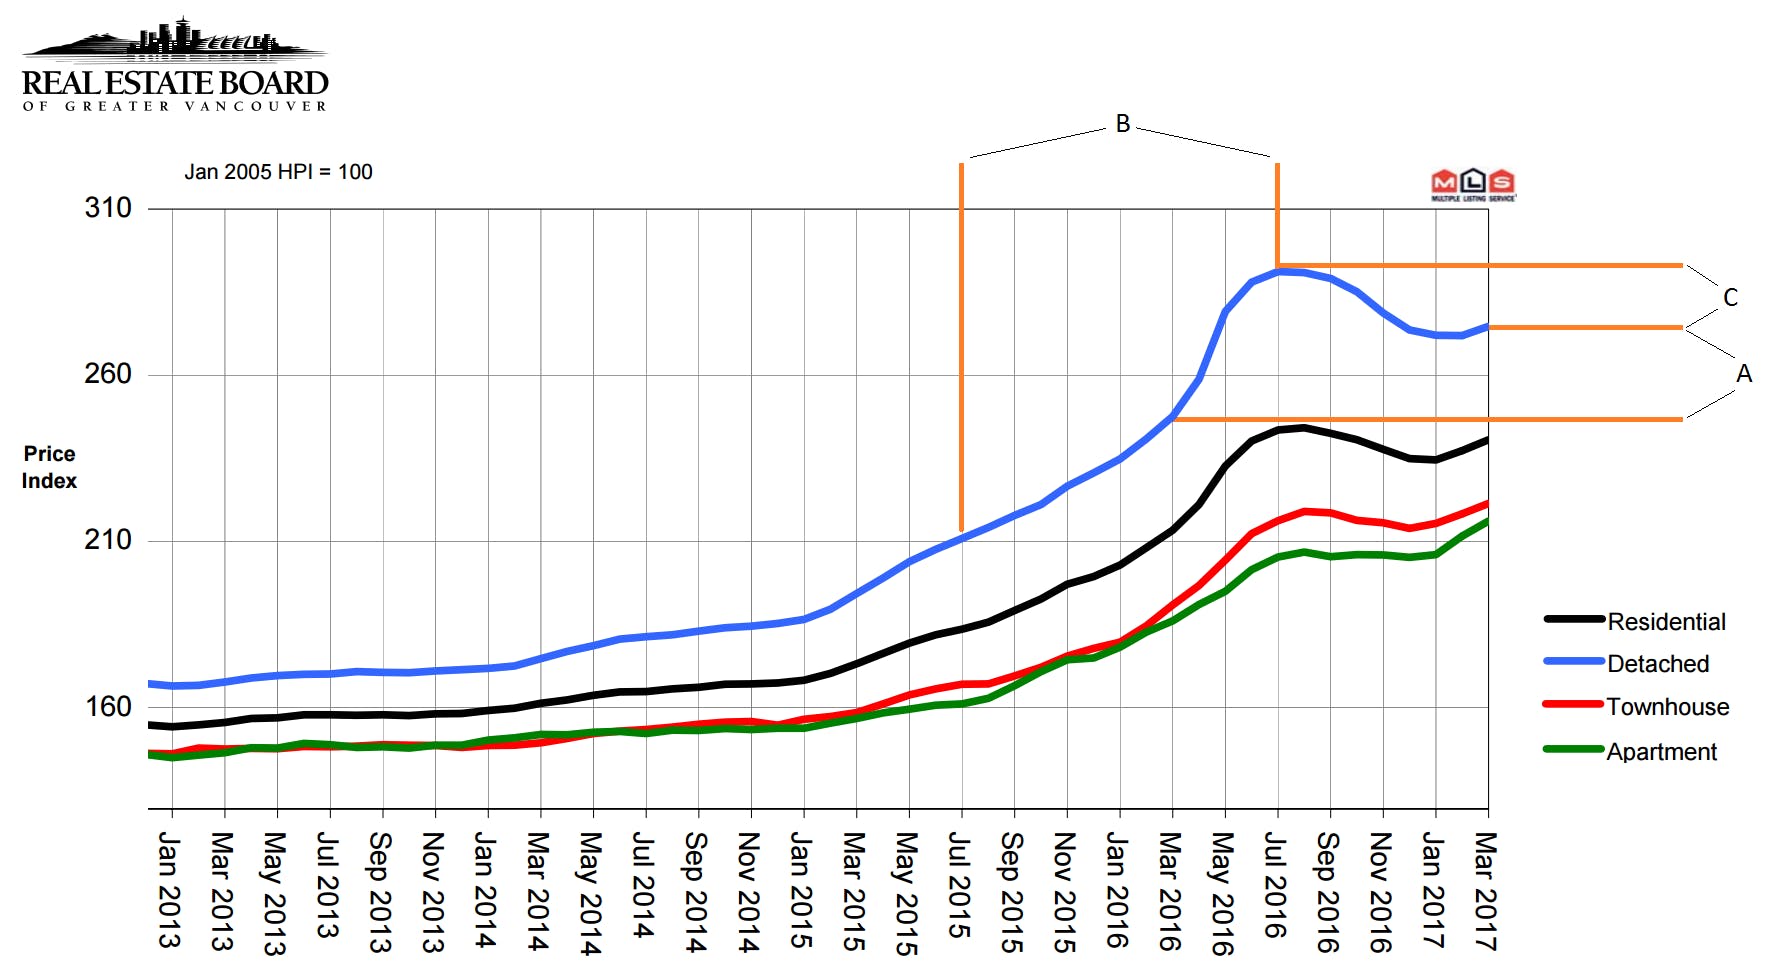
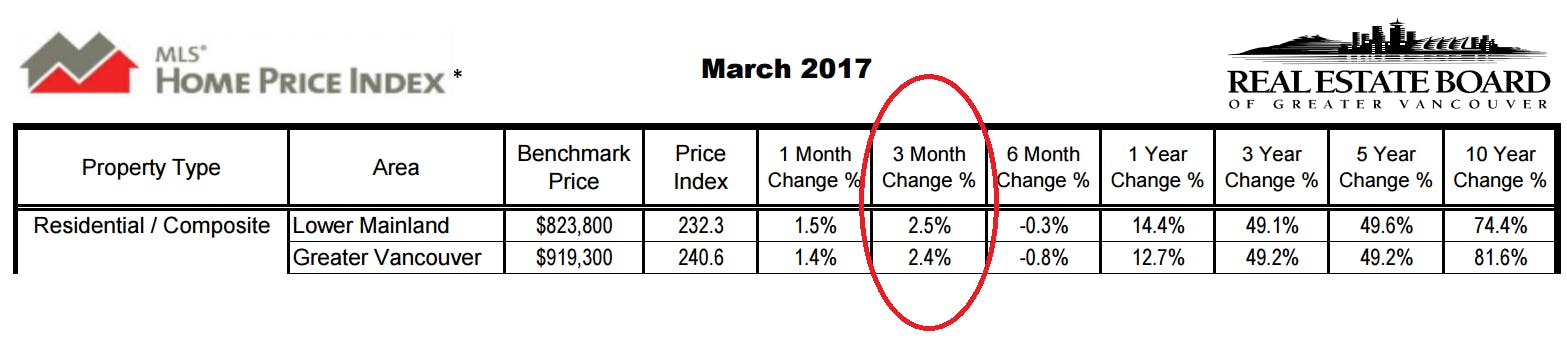
The market certainly rose 12.3% from March 2016 to March 2017 (comparison “A”). However, March 2016 is also right before it went through the roof, where by July 2016, Greater Vancouver detached properties had risen a whopping 38% year over year (comparison “B”). Why not mention anything about the decline shown in comparison “C”? Or better yet, state both in quarterly terms? Well that would be because prices have actually only risen 2.4% last quarter, which certainly does not pack as much of a punch.
Now, you may say “yes, but the market is rising.” Pricewise, perhaps, but here’s the thing… prices are determined by supply and demand, and here is an exert from the Real Estate Board of Greater Vancouver’s March press release:
“New listings for detached, attached and apartment properties in Metro Vancouver totalled 4,762 in March 2017. This represents a decrease of 24.1 per cent compared to the 6,278 units listed in March 2016 and a 29.9 per cent increase compared to February 2017 when 3,666 properties were listed.
This is the lowest number of new listings in March since 2009.”
The increase in listings from February to March is simply the seasonal bump as we move into what is traditionally the busiest time of the year in real estate, the spring market. But the fact remains that we are at the lowest inventory levels since 2009. So when I hear agents throwing around newly formed catch phrases like “market whiplash” because nearly 50% of the listings they’ve dealt with went into bidding wars, it is clear and irresponsible misrepresentation of the facts in order to stimulate the market for personal gain.
Look, I’m not going to sit here and pretend I have a crystal ball. Perhaps by September, we will see another 15% increase in prices, inventories rise, and the Vancouver market turn into an all-out inferno… but my fellow colleagues, don’t pull the wool over the public’s eyes by presenting only the numbers that fit your narrative.
Link to the March stats package from the Real Estate Board of Greater Vancouver:
Links to some of the news stories cited above:
http://www.news1130.com/2017/04/18/despite-price-drop-housing-market-royal-lepage/